
Canterbury's average home sold for £336,427 in August, £855 less than a year ago. Flats fell £5,037 while semis and terraces rose. Eighth of 13 in Kent.
The average home in the Canterbury district sold for £336,427 in August 2026. That is £855 less than in August 2025, a fall of 0.3 per cent.
The figures are from the UK House Price Index, which HM Land Registry published on 21 October. They are the latest available; September’s figures are due in November.
A month ago the same index showed the district up 2.9 per cent in a year. So what changed? Not prices in Canterbury this summer. They barely moved. What changed is the month they are being compared with.
Why a flat month became an annual fall
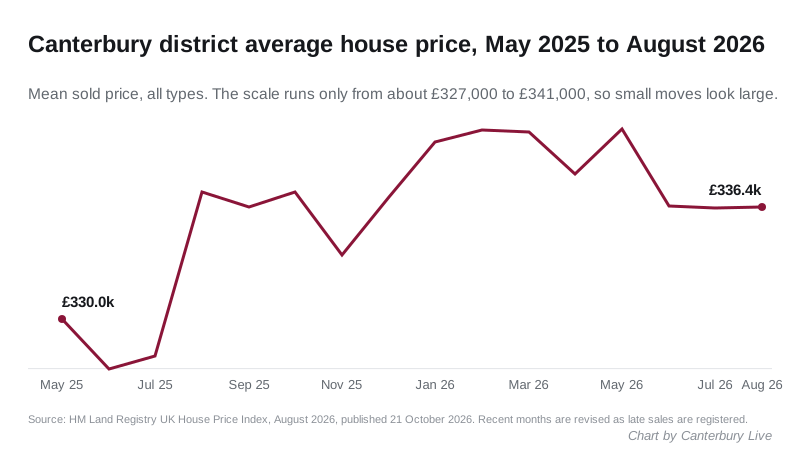
Last summer, the district average dipped and then jumped. It went from £327,814 in July 2025 to £337,282 in August 2025, a rise of £9,468 in a single month. July 2026 is being measured against the low point. August 2026 is being measured against the jump.
This year the line has been almost flat:
- July 2026: £336,349
- August 2026: £336,427, up £78 on the month
The district has stayed between about £336,000 and £341,000 every month since December 2025, according to the Land Registry’s series for the district. In May 2025 it was £329,976.
The index has also been revised since we reported July’s figures. July 2026 was first published at £337,454, up 2.9 per cent. It now stands at £336,349, up 2.6 per cent, because more July sales have been registered since. Recent months often move like this, so treat any single month with care.
The index is a mean average, not a median, so a few large sales can pull it up. It covers the whole city council area: Canterbury, Whitstable, Herne Bay and the villages.
Flats are down, semis and terraces are up
Split by property type, August 2026 against August 2025:
| Type | August 2026 | Change in a year |
|---|---|---|
| Detached | £532,531 | down £1,649 (0.3%) |
| Semi-detached | £348,636 | up £2,194 (0.6%) |
| Terraced | £302,753 | up £1,543 (0.5%) |
| Flat or maisonette | £183,434 | down £5,037 (2.7%) |
| First-time buyer average | £284,041 | down £195 (0.1%) |
Flats are again the weakest part of the district’s market. Canterbury has a large stock of flats, much of it let to students at the city’s universities. In July a flat was worth £54 more than a year before; by August it was worth £5,037 less.
Houses in the middle of the market, semis and terraces, are still edging up.
Where Canterbury sits in Kent and Medway
Annual change to August 2026, from the same release:
| Area | Average price | Change in a year |
|---|---|---|
| Swale | £296,578 | +0.6% |
| Medway | £297,757 | +0.5% |
| Dover | £282,945 | +0.4% |
| Sevenoaks | £535,810 | +0.4% |
| Gravesham | £342,498 | +0.3% |
| Tonbridge and Malling | £405,507 | -0.1% |
| Tunbridge Wells | £452,845 | -0.1% |
| Canterbury | £336,427 | -0.3% |
| Folkestone and Hythe | £302,106 | -0.7% |
| Ashford | £340,991 | -0.8% |
| Thanet | £268,549 | -0.8% |
| Maidstone | £352,878 | -1.1% |
| Dartford | £342,167 | -4.9% |
Canterbury is eighth of the 13 areas. It did slightly better than Kent County Council’s area as a whole, where the average fell 0.5 per cent to £345,200, and better than the South East, down 0.8 per cent to £379,953.
Its neighbours split. Swale, which includes Faversham, and Dover both rose. Thanet and Ashford fell further than Canterbury did.
What it means for you
- If you are selling, the headline fall says more about last August than about this one. The district average has hardly moved since the spring.
- If you are buying a flat, prices are lower than a year ago, and this is the type that has been weakest for the past year.
- If you are a first-time buyer, the average price you pay, £284,041, is almost exactly where it was a year ago.
- For your own street, the district average will not tell you much. Our Canterbury house prices page explains where to find the price paid for individual homes.
The council tax band of a home is unaffected by any of this: bands still rest on 1991 values. Our council tax bands page has the charges for 2026/27.
Sources: HM Land Registry, UK House Price Index for August 2026, published 21 October 2026, and the Land Registry’s UKHPI data for the Canterbury district and the other Kent and Medway authorities, read on 31 October 2026.
Have your say