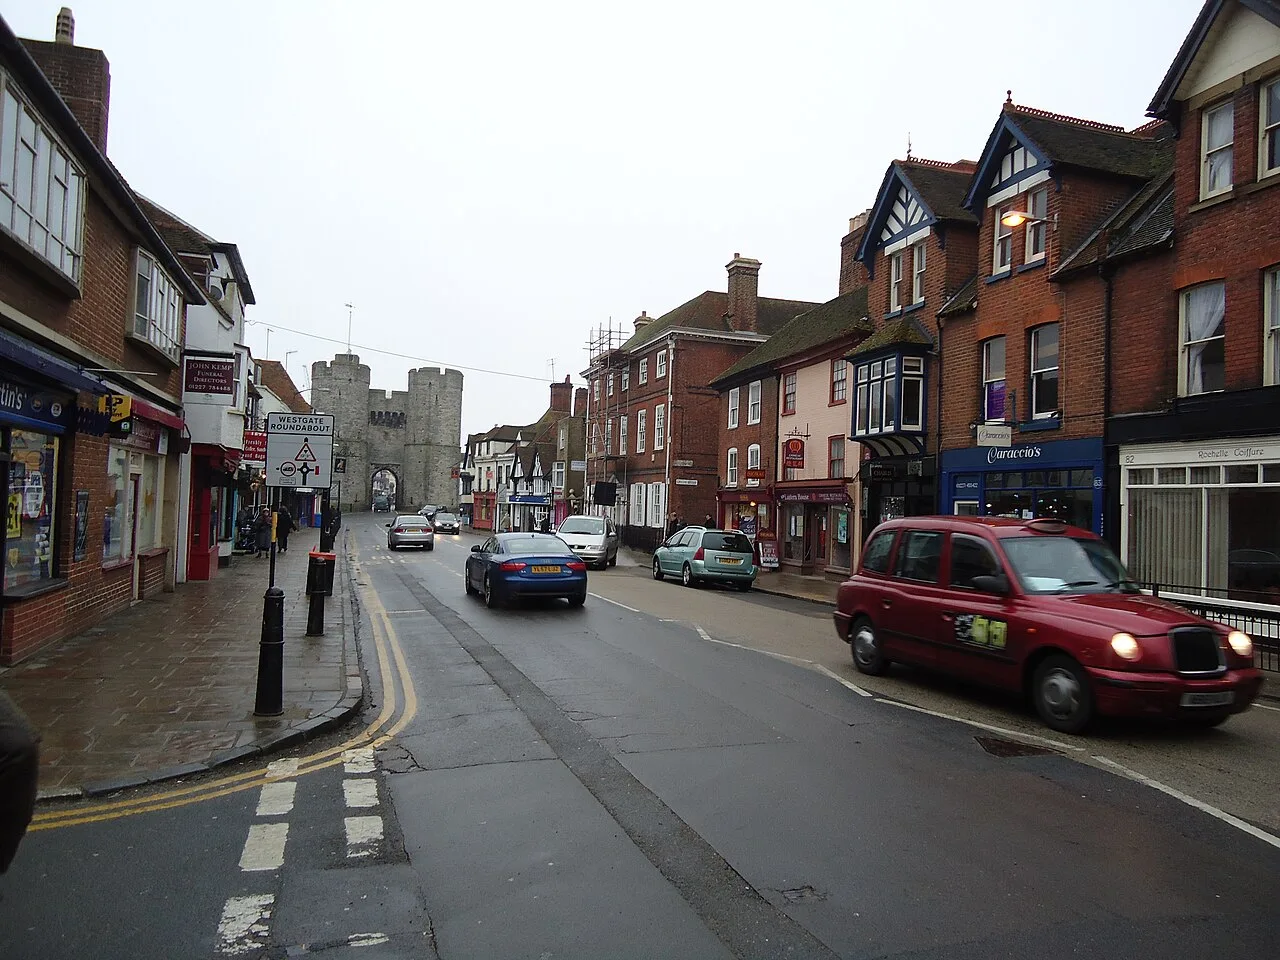

The average Canterbury home sold for £337,454 in July 2026, up £9,640 in a year. Prices by type, the dearest streets and how the district compares with Kent.
If you own a home in Canterbury, Whitstable or Herne Bay, or you are trying to buy one, the question is always the same: what are they actually selling for? Asking prices in agents’ windows tell you what sellers hope. The figure that matters is what completed sales record at HM Land Registry, and this page is a plain reading of those numbers: the district average, which way it is moving, what each property type costs, the dearest streets, and how the Canterbury district compares with Kent and England.
The headline figure
The average home in the Canterbury district sold for £337,454 in July 2026, according to the provisional UK House Price Index, which is built from completed Land Registry sales rather than asking prices. That covers the whole city council area: Canterbury itself, Whitstable, Herne Bay and the villages.
Prices were up 2.9% in the twelve months to July 2026, a rise of £9,640, and ahead of Kent as a whole at 1.5% and the South East at 0.2%. That was the third strongest annual rise of the 13 local authority areas in Kent and Medway. On the month the district barely moved, up 0.1%. We covered the release in full in Canterbury house prices up £9,640 in a year.
The district average is still £33,032 below its record, the £370,486 set in March 2023.
Treat any single month as provisional. June was first published as £338,030 and the July release restated it as £336,970, £1,060 lower. The index is rebuilt each month as more completed sales are registered.
One caution about other figures you will see. Property portals quote a Canterbury average closer to £443,000, and both numbers are real: the portal figure (PropertySolvers, from Land Registry data through June 2026) covers the Canterbury town listing area, which is weighted towards the city’s larger houses, while the £337,454 figure covers every sale across the whole district, including the flats that make up much of the stock in a university city. Always check which geography a number describes before you compare.
What it means for you
If you are selling, price against the type figure below rather than the district average, and expect the process to take time: PropertySolvers’ Canterbury data shows homes taking around 116 days from listing to completion and selling about 3% under asking on average. If you are buying, the annual trend is still upward while month-to-month movements have stayed inside a percentage point either way all year, so a monthly figure quoted at you is weak evidence. And if you are staying put, your home is worth about 3% more than a year ago on paper but still less than it would have fetched at the 2023 peak, while council tax is the bill that actually changed.
Prices by property type
The district average hides a wide spread. These are the Canterbury district averages for July 2026 from the UK House Price Index:
- Detached houses: £536,016, up 3.1% on the year.
- Semi-detached houses: £349,935, up 4.0%, the fastest-rising type.
- Terraced houses: £302,361, up 3.4%. The classic Canterbury and Whitstable street stock.
- Flats and maisonettes: £183,424, up 0.0%. Twelve months added £54 to the average flat.
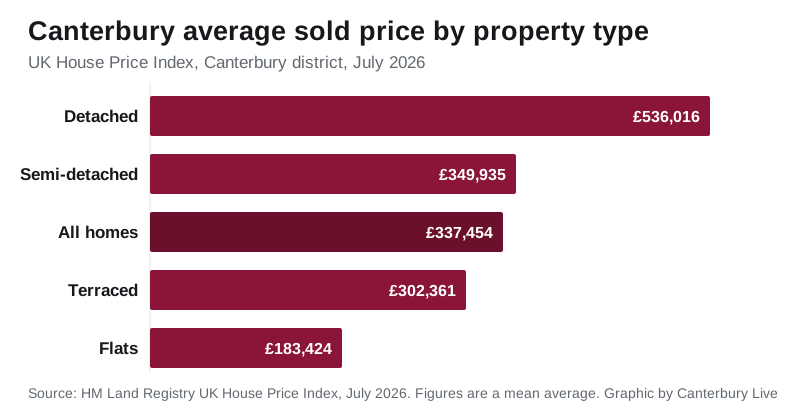
The pattern is the same one most of Kent shows, only stronger: family houses are scarce and bid up, while flats, the property type most exposed to mortgage costs and to the student-landlord market, are barely moving.
First-time buyers and home movers
The index also splits buyers. A first-time buyer in the district paid an average of £284,509 in July 2026, while a home mover, someone selling one property to buy another, paid £401,647. The £117,138 gap between those figures is, in effect, the price of the step up from a first flat or terrace to a family house in this part of Kent.
The dearest streets
Sold-price records compiled by PropertySolvers for the Canterbury town area (data through June 2026) put the highest recent averages on:
- Polo Field Drive, around £1,060,000 across four sales.
- Ethelbert Road, the tree-lined street by the Kent and Canterbury Hospital, around £895,000 across three sales.
At the other end of the same records, averages on streets such as Parham Road sit below £70,000, reflecting park homes and retirement stock rather than ordinary houses. In between, the district’s most common sale band was £242,000 to £314,000, which is terraced-house territory. On the coast, Whitstable’s beach-adjacent streets behave like the city’s premium roads; the same house a mile inland in Herne Bay costs meaningfully less, which is why the district average sits where it does.
How Canterbury compares
| Area | Average price | Annual change |
|---|---|---|
| Canterbury district | £337,454 | +2.9% |
| Kent | £346,904 | +1.5% |
| South East | £380,878 | +0.2% |
| England | £293,479 | +1.1% |
Source: HM Land Registry UK House Price Index, July 2026.
Canterbury sits £9,450 below the Kent county average and well below the South East as a whole, but it is rising faster than either over twelve months. The things propping demand up are structural: two mainline stations with a high-speed route to London, two universities, the hospital, and a coastline that turned Whitstable into one of Kent’s most fashionable markets. The pressure ahead is on the supply side, with the district’s new Local Plan allocating land for more than 20,000 new homes over the next two decades.
Frequently asked questions
What is the average house price in Canterbury?
The average home in the Canterbury district sold for £337,454 in July 2026, according to the provisional UK House Price Index built from HM Land Registry completed sales. Figures quoted for Canterbury town alone are higher, around £443,000, because they exclude the cheaper edges of the district and lean towards larger houses.
Are Canterbury house prices rising or falling?
Rising over the year, flat in the latest month. Prices across the district were up 2.9% in the year to July 2026, ahead of Kent (+1.5%), the South East (+0.2%) and England (+1.1%), and up 0.1% on June. Semi-detached homes rose fastest over the year at 4.0%; flats did not move at all, gaining £54 in twelve months.
How much is a house in Whitstable or Herne Bay?
The index reports at district level, so there is no official monthly average per town, but the pattern in sold prices is consistent: Whitstable’s sought-after streets trade at a premium above the district average, while Herne Bay remains the more affordable of the two coastal towns. For a specific street, check the free Land Registry sold-price search.
How much deposit do I need for an average Canterbury home?
A 10% deposit on the district average of £337,454 is about £33,700; a first-time buyer paying the average first-time price of £284,509 needs about £28,450 at 10%. Flats, averaging £183,424, cut that to under £18,400.
Where can I check what a specific house sold for?
Every completed sale in England and Wales is public record. Search any address free at HM Land Registry’s sold-price service, or browse the same data on Rightmove or Zoopla.
Sources
- UK House Price Index, Canterbury (ONS / HM Land Registry) for the district average, annual change, property-type and buyer-type figures.
- UK House Price Index data service for the July 2026 Canterbury, Kent, South East and England figures.
- PropertySolvers Canterbury house prices for the town-area average, dearest streets, time-to-sell and asking-versus-sold gap.
- HM Land Registry Price Paid search to check any individual address.
Index figures are provisional and revised as more sales complete. Confirm the latest numbers against the linked HM Land Registry and ONS sources before making a decision.
Have your say