
Canterbury's average home reached £337,454 in July, up £9,640 in a year and third fastest in Kent. Semis rose 4 per cent, flats gained £54 in twelve months.
The average home in the Canterbury district sold for £337,454 in July 2026, up £9,640 on July last year. The figures come from the UK House Price Index published by HM Land Registry on 16 September.
That annual rise of 2.9 per cent is the third strongest of the 13 local authority areas in Kent and Medway. It is roughly double Kent’s 1.5 per cent, and the South East as a whole managed only 0.2 per cent.
On the month, almost nothing happened. The district was up 0.1 per cent on June.
The index is a mean average, not a median, so a handful of large sales pull it upwards. It covers the whole city council area: Canterbury, Whitstable, Herne Bay and the villages.
Semis are doing the work, flats are doing nothing
Split the district average by property type and the year has gone in two directions at once.
| Type | July 2026 | Change in a year |
|---|---|---|
| Detached | £536,016 | +£16,238 (+3.1%) |
| Semi-detached | £349,935 | +£13,483 (+4.0%) |
| Terraced | £302,361 | +£9,976 (+3.4%) |
| Flat or maisonette | £183,424 | +£54 (+0.0%) |
A flat in the district is worth £54 more than it was a year ago. Every type of house is up by five figures.
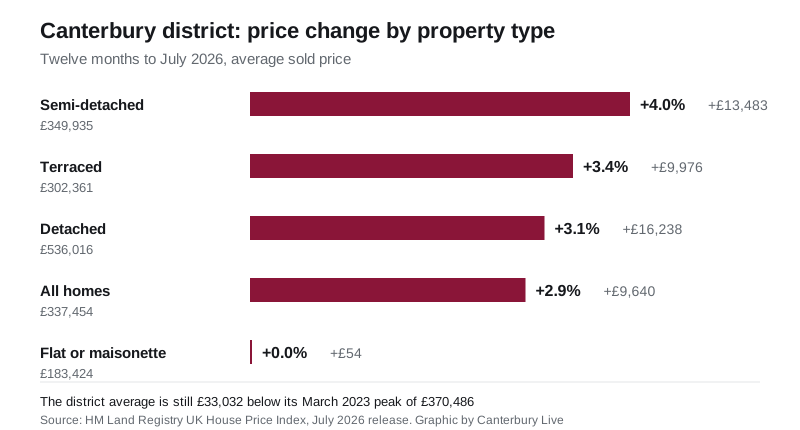
That gap matters more here than in most districts. Canterbury has two universities and a large purpose-built and converted flat stock, and it is the part of the market that has not recovered.
The district is still £33,032 below its peak
The record for the Canterbury district average is £370,486, set in March 2023. July’s £337,454 is £33,032 short of it, a gap of 8.9 per cent, more than three years later.
Put the two facts together and the picture is neither a boom nor a slump. Prices have been grinding back up from a 2025 trough, and are still well below where they were before mortgage rates rose.
Where Canterbury sits in Kent
Annual change across Kent and Medway, July 2026:
| Area | Average price | Change in a year |
|---|---|---|
| Gravesham | £344,923 | +3.3% |
| Swale | £298,985 | +3.2% |
| Canterbury | £337,454 | +2.9% |
| Dover | £277,750 | +2.7% |
| Thanet | £269,708 | +1.8% |
| Ashford | £347,562 | +1.4% |
| Tonbridge and Malling | £407,880 | +1.4% |
| Medway | £298,547 | +1.1% |
| Sevenoaks | £538,714 | +1.0% |
| Folkestone and Hythe | £303,296 | +0.9% |
| Tunbridge Wells | £456,227 | +0.6% |
| Maidstone | £352,722 | -0.1% |
| Dartford | £347,773 | -2.0% |
The pattern inverts the price order. The strongest growth is in the cheaper half of the county, and the two areas that fell over the year are mid-priced. Across England, 85 of the 295 local authority areas were down on the year. Canterbury ranks 102nd from the top.
First-time buyers paid £284,509
The index also splits buyers by type. In the Canterbury district in July:
- a first-time buyer paid an average of £284,509, up £8,322 (3.0 per cent) in a year
- a former owner-occupier, someone selling one home to buy another, paid £401,647
The £117,138 between those two figures is the cost of the step up from a first flat or terrace to a family house in this district.
Sales are thinner than last year, on the counts published so far
The index publishes sales counts with a lag, and there is no figure yet for June or July. May 2026 is the latest month counted: 136 sales, against 132 in May 2025.
Across January to May the totals are 648 sales in 2026 against 934 in 2025. One month dominates that difference. March 2025 recorded 406 sales, more than any other month in either year. Excluding March from both, the comparison is 483 sales this year against 528 last year.
A correction to our June figure
When we reported the June release we gave the district average as £338,030, a fall of £5,665 on May. That was the figure as first published.
The Land Registry has since restated June as £336,970, £1,060 lower, and May as £341,146. On the revised numbers, June’s fall was £4,176 rather than £5,665. The index is rebuilt every month as more completed sales are registered, which is why no single month should be read on its own.
What it means for you
If you are selling, price against your property type, not the district average. A semi-detached seller and a flat seller are in different markets this year: one has gained £13,483 on paper in twelve months, the other £54.
If you are buying, the annual figure is the one worth using. Month-to-month movements in this district have been within a percentage point either way all year, and they get revised.
If you are staying put, the useful comparison is the peak. A home bought in the district at the March 2023 average is, on these figures, still worth less than it cost, while council tax has gone up every year since.
To check what a specific address actually sold for, use HM Land Registry’s free price paid search. Our Canterbury house prices page carries the full district picture, including prices by type and how the district compares with Kent and England.
Have your say