
Canterbury's average home fell to £338,030 in June, a £5,665 drop and the steepest anywhere in Kent. Prices by type, and how May was revised down by £2,979.
The average home in the Canterbury district sold for £338,030 in June 2026, down £5,665 on May, according to figures published by HM Land Registry on 19 August.
That monthly fall of 1.6 per cent was the steepest of any local authority area in Kent. Across England only seven of the 295 local authority districts fell further, although 113 of them fell.
Prices are still higher than a year ago. The June average was up £10,914, or 3.3 per cent, on the £327,116 recorded in June 2025. Canterbury’s annual rise remains ahead of Kent as a whole (2.1 per cent), England (1.8 per cent) and the South East (0.3 per cent).
Canterbury fell hardest in Kent
Kent overall barely moved in June, up 0.1 per cent to £346,118. The district figures underneath that average pulled in opposite directions.
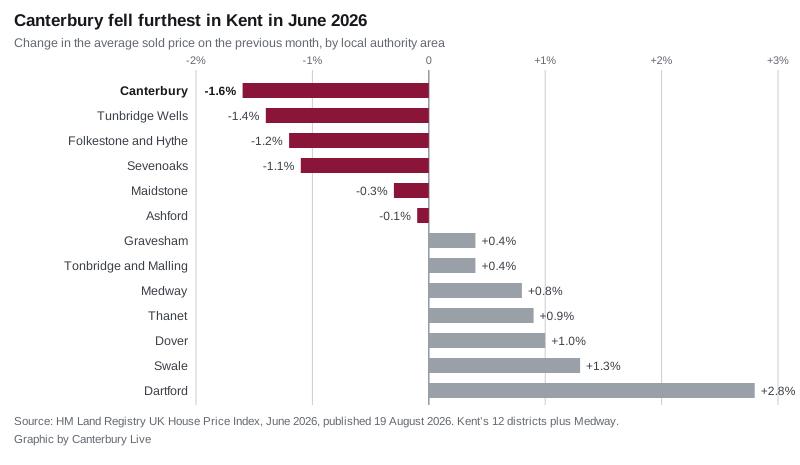
Six of the county’s areas fell on the month and seven rose. Canterbury was bottom of the table, which lists Kent’s 12 district councils plus the Medway unitary authority:
| District | Average price | Change on May |
|---|---|---|
| Canterbury | £338,030 | -1.6% |
| Tunbridge Wells | £445,133 | -1.4% |
| Folkestone and Hythe | £304,717 | -1.2% |
| Sevenoaks | £543,081 | -1.1% |
| Maidstone | £352,191 | -0.3% |
| Ashford | £344,332 | -0.1% |
| Gravesham | £345,369 | +0.4% |
| Tonbridge and Malling | £405,932 | +0.4% |
| Medway | £296,182 | +0.8% |
| Thanet | £268,760 | +0.9% |
| Dover | £276,234 | +1.0% |
| Swale | £298,394 | +1.3% |
| Dartford | £351,594 | +2.8% |
A single month is a single month, and this index is volatile at district level. The longer pattern is worth more: Canterbury has now sat below the Kent average in every month of 2026, and June opened the widest gap of the year, £8,088.
Every property type fell
The drop was not confined to one part of the market. All four property types recorded a lower average in June than in May:
- Detached: £536,590, down 1.8% on the month, up 2.9% on the year
- Semi-detached: £350,836, down 1.6% on the month, up 4.4% on the year
- Terraced: £302,063, down 1.6% on the month, up 4.1% on the year
- Flats and maisonettes: £184,239, down 1.5% on the month, up 1.1% on the year
Over the year rather than the month, the middle of the market has done the work. Semi-detached and terraced homes are up 4.4 and 4.1 per cent, while flats have risen just 1.1 per cent. That gap matters in a district with as much flatted stock as Canterbury: a flat owner hoping to trade up to a terrace has seen the distance between the two grow, not shrink.
The Land Registry also splits the index by buyer. A first-time buyer in the district paid an average of £285,086 in June, down 1.6 per cent on the month and up 3.6 per cent on the year. A home mover, someone selling one property to buy another, paid £402,243.
May was revised down by £2,979
The June release also restated May. When the May index was published on 31 July, the Canterbury district average was given as £346,674, an annual rise of 5.1 per cent. In this month’s file that same May figure has been revised to £343,695, up 4.2 per cent.
This is normal. The index is rebuilt each month as more completed sales are registered, and early months are the least complete. It is also the reason to treat any single monthly figure, including June’s, as provisional. Some of the £5,665 fall may be revised away in September.
What it means for you
If you are selling. Use the type figure, not the district average. A terraced home in the district averages £302,063 and a detached home £536,590, and the gap between them is larger than the whole monthly movement being reported. The headline average also moves when the mix of homes sold changes, so a month with fewer large detached sales pulls it down without any individual house losing value.
If you are buying. Nothing in this release changes what you can borrow. It does tell you that asking prices set in the spring were set against a higher published district average than the one that now stands, and that May’s number has already been marked down once.
Read the average correctly. UK House Price Index figures are a mean, not a median. A handful of expensive sales in Chartham or the villages lifts the mean in a way it would not lift a median. The figure describes the market, not your house.
How many homes are actually selling. The Land Registry holds back sales volumes for the two most recent months. The latest published count for the district is therefore April 2026, at 96 sales, with 150 in March. Read those against the stamp duty threshold change of 1 April 2025, which pulled completions forward. The district recorded 406 sales in March 2025 and 77 in April 2025.
The July 2026 index, which will revise June again, is due at 9.30am on Wednesday 16 September.
What we hold on this locally
- Our Canterbury house prices page carries the full district breakdown, how Canterbury compares with Kent and England, and the dearest streets.
- Canterbury council tax bands, which is the other number that changes when you move.
- Canterbury planning applications, for what is being built and where.
- Canterbury train times to London, the commute that underpins a good deal of demand in the district.
Sources
- UK House Price Index, Canterbury district, June 2026, HM Land Registry.
- UK House Price Index, Kent, June 2026, HM Land Registry.
- UK HPI full data file, June 2026, used for the Kent district table and the England ranking.
- UK House Price Index reports and release dates, GOV.UK.
- Local house price data for Canterbury, Office for National Statistics.
Contains HM Land Registry data © Crown copyright and database right 2026, licensed under the Open Government Licence v3.0.
Update, 19 September 2026: HM Land Registry has since revised these figures. June’s Canterbury district average is now restated as £336,970, £1,060 below the £338,030 reported here, and May is restated as £341,146. On the revised numbers June’s fall was £4,176, not £5,665. The figures above were correct as first published. The latest release is covered in Canterbury house prices, July 2026.
Have your say