
Shoplifting within a mile of central Canterbury hit 1,132 in the year to July, up 64% on two years earlier. Violence fell 14%. Whitstable's spike is easing.
Kent Police recorded 1,132 shoplifting offences within a mile of central Canterbury in the twelve months to July 2026. Two years earlier, the same area recorded 692. That is a rise of 64 per cent.
Violent crime moved the other way. It fell from 2,411 to 2,078 over the same two years, a drop of 14 per cent.
The figures come from the street-level crime data Kent Police publishes through police.uk. July 2026 is the latest month released. We pulled every month from August 2023, the earliest the service still holds, and counted them ourselves.
What changed in two years
The count below covers a one-mile radius of a point beside the cathedral precincts. That takes in the shopping streets, both railway stations, the bus station and the inner ring road.
| Crimes within a mile of central Canterbury | Aug 2023 to Jul 2024 | Aug 2024 to Jul 2025 | Aug 2025 to Jul 2026 |
|---|---|---|---|
| Violence and sexual offences | 2,411 | 2,170 | 2,078 |
| Antisocial behaviour | 946 | 1,033 | 1,364 |
| Shoplifting | 692 | 1,029 | 1,132 |
| Criminal damage and arson | 565 | 496 | 597 |
| Other theft | 431 | 405 | 418 |
| Drugs | 320 | 344 | 317 |
| Public order | 384 | 354 | 295 |
| Robbery | 80 | 76 | 111 |
| Burglary | 156 | 158 | 111 |
| Bicycle theft | 81 | 80 | 103 |
| All crime and antisocial behaviour | 6,521 | 6,666 | 6,926 |
The overall total rose by 6 per cent across the two years. Almost all of that came from two categories:
- Shoplifting: up 440 reports, or 64 per cent
- Antisocial behaviour: up 418 reports, or 44 per cent. Most of that rise came in the latest year, up 32 per cent on the year before.
Several other categories fell:
- Violence and sexual offences: down 333, or 14 per cent
- Public order offences: down 89, or 23 per cent
- Burglary: down 45, or 29 per cent
Robbery rose from 80 to 111. It is a small category, so a handful of incidents moves it a long way.
When the shoplifting rise happened
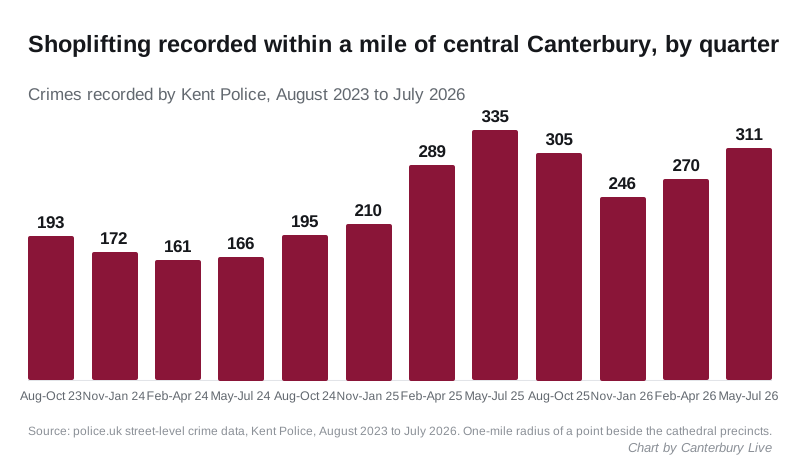
The jump was not gradual. Quarterly shoplifting sat between 161 and 195 until October 2024. It then climbed to 289 in February to April 2025, and 335 in May to July 2025.
It has not gone back down. The latest quarter, May to July 2026, recorded 311.
Police.uk records where an offence was reported, not who was caught. A rise in recorded shoplifting can reflect more thefts, more reporting by shops, or both. The data does not separate the two.
Where the reports were mapped
Police.uk places each report at the nearest of a fixed set of map points, to protect the privacy of victims. The locations below are those points, not exact addresses.
In the twelve months to July 2026, the points with the most shoplifting reports were:
- On or near St Dunstan’s Street: 137
- On or near a shopping area point in the city centre: 129
- On or near a supermarket point on the south-west side of the city: 120
- On or near St George’s Lane: 95
St Dunstan’s Street is the biggest change. It had 32 shoplifting reports in the twelve months to July 2024, against 137 now. Butchery Lane went the other way, from 85 to 71.
July on its own
The July release itself was mixed. Police recorded 616 crimes within the same one-mile area in July 2026, against 709 in July 2025.
- Violence and sexual offences: 218, up from 160 in June. That is the highest monthly figure since May 2024, when there were 222. It is almost exactly the same as July 2025, which had 216.
- Antisocial behaviour: 114, down from 149 a year earlier
- Shoplifting: 91, down from 109 a year earlier
Summer months tend to run higher in the city centre. July 2025 was the busiest month in the three years of data.
Whitstable and Herne Bay
We ran the same one-mile count around the centres of Whitstable and Herne Bay.
| Twelve months to July | 2024 | 2025 | 2026 |
|---|---|---|---|
| Whitstable: shoplifting | 144 | 399 | 450 |
| Whitstable: antisocial behaviour | 192 | 237 | 285 |
| Herne Bay: shoplifting | 279 | 363 | 306 |
| Herne Bay: antisocial behaviour | 335 | 356 | 531 |
Whitstable’s shoplifting figure is more than three times what it was two years ago. But the spike has passed its peak. Monthly reports rose from 14 in December 2024 to 85 in July 2025 and 91 in August 2025. From January to July 2026 there were 194, against 339 in the same seven months of 2025.
Herne Bay’s shoplifting fell in the latest year. Its antisocial behaviour count did not: 531 reports, up 59 per cent on two years earlier.
What it means for you
- If you run a shop, the figures above only show thefts that were reported. Kent Police takes reports online or on 101. Call 999 if a crime is happening now.
- If antisocial behaviour is affecting your street, Canterbury City Council takes reports through its online form. The council says to call 999 if it puts you, your family or your property in immediate danger.
- To see your own street, enter a postcode at police.uk. The map shows the same data we used, month by month.
How we counted
We used the police.uk street-level crime API, which returns every recorded crime and antisocial behaviour report within one mile of a chosen point for a given month. The Canterbury point is at latitude 51.2798, longitude 1.0789, beside the cathedral precincts. The Whitstable and Herne Bay points sit in each town’s main shopping street.
The twelve-month windows run from August to July, so that the latest one ends with the newest data. Figures are recorded offences. They are not charges or convictions, and some reports are later reclassified.
Read more Canterbury data: house prices in July 2026 and the August claimant count.
Have your say