
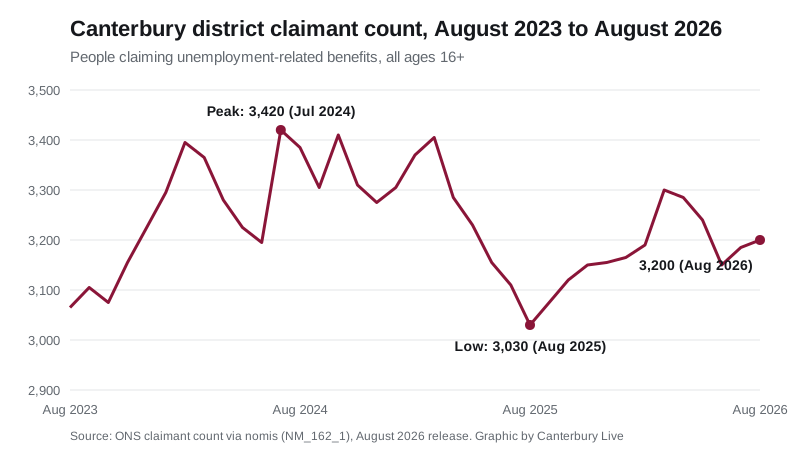
3,200 people in the Canterbury district claimed in August, up 15 on a revised July. Under-25 claimants rose 40 to 785, joint highest since September 2021.
3,200 people in the Canterbury district were claiming unemployment-related benefits in August 2026. That is up 15 on July, according to the Office for National Statistics figures published on nomis on 15 September.
It was one of the smallest rises in Kent. Across the county the count went up 1.7 per cent in a month, against 0.5 per cent in this district.
The number to watch is the under-25s. 785 claimants were aged 16 to 24, up 40 on July. That matches April 2026 as the highest figure for that age group since September 2021.
July’s big rise has been revised away
Last month we reported that Canterbury had the largest rise in Kent in July, with the count up 100 to 3,250. The ONS has since revised July’s figure down to 3,185. On the revised numbers, July’s rise was 35, not 100.
The figure we reported was correct as first published. But the revision means a single month’s movement is a weak signal on its own.
The district’s rate is unchanged at 3.2 per cent of residents aged 16 to 64. The Kent rate rose to 3.4 per cent and the UK rate to 3.9 per cent.
How Kent compares
Eleven of the 13 local authority areas in Kent and Medway had more claimants in August than in July. Only Dartford and Folkestone and Hythe were flat. Gravesham and Swale rose fastest.
| Area | August 2026 | Change on July | Change on a year |
|---|---|---|---|
| Gravesham | 2,960 | +130 (+4.6%) | +20 (+0.7%) |
| Swale | 3,410 | +110 (+3.3%) | +100 (+3.0%) |
| Sevenoaks | 1,675 | +40 (+2.4%) | +145 (+9.5%) |
| Thanet | 4,455 | +95 (+2.2%) | +350 (+8.5%) |
| Medway | 7,700 | +150 (+2.0%) | +240 (+3.2%) |
| Maidstone | 3,980 | +65 (+1.7%) | +380 (+10.6%) |
| Tonbridge and Malling | 2,095 | +35 (+1.7%) | +195 (+10.3%) |
| Tunbridge Wells | 1,805 | +25 (+1.4%) | +185 (+11.4%) |
| Dover | 2,300 | +30 (+1.3%) | 0 (0.0%) |
| Ashford | 2,515 | +25 (+1.0%) | +55 (+2.2%) |
| Canterbury | 3,200 | +15 (+0.5%) | +170 (+5.6%) |
| Dartford | 2,605 | 0 | +260 (+11.1%) |
| Folkestone and Hythe | 2,450 | 0 | +35 (+1.4%) |
Over twelve months the picture is less comfortable. Canterbury’s count is up 5.6 per cent on August 2025, close to Kent’s 6.0 per cent rise and well ahead of the UK’s 2.1 per cent. It sits seventh of the 13 areas on that measure.
Kent here means the county council area, which does not include Medway. It had 33,450 claimants in August.
The whole year’s rise is the young and the over-50s
Break the district’s figure down by age and the annual increase has a clear shape.
| Age | August 2025 | July 2026 | August 2026 |
|---|---|---|---|
| 16 to 24 | 690 | 745 | 785 |
| 25 to 49 | 1,645 | 1,675 | 1,645 |
| 50 and over | 695 | 770 | 770 |
| All ages | 3,030 | 3,185 | 3,200 |
- Under-25s are up 95 on a year, more than half of the district’s rise of 170.
- Over-50s are up 75 on a year, and flat on July.
- Claimants aged 25 to 49 are exactly where they were a year ago, at 1,645, and fell 30 in August.
Under-25s now make up just under a quarter of the district’s claimants. The count for that age group was as low as 560 in the summer of 2022.
The figures carry no reason for a claim, so they cannot say whether the young claimants are students, school leavers or people who have lost work. September’s figure will show whether the August rise holds.
What it means for you
What the figure counts. The claimant count is not the unemployment rate. The ONS defines it as people claiming Jobseeker’s Allowance plus those on Universal Credit who are required to look for work. Someone out of work but not required to seek it is not counted. Someone working limited hours on Universal Credit can be.
Why the district figure matters. Very few jobs measures are published monthly for the Canterbury district itself rather than for Kent. This is the earliest local signal available, but as July’s revision shows, read it over several months rather than one.
If you are under 25 and out of work. Universal Credit claims and Jobcentre Plus support start at GOV.UK. Canterbury City Council lists the money and welfare advice it funds on its benefits and support pages.
Related on Canterbury Live
- Canterbury claimant count, July 2026, with the figures as first published.
- Canterbury house prices, the other monthly district number worth watching.
- Canterbury council tax bands and the reductions available.
Sources
- Claimant count, Canterbury district, ONS via nomis dataset NM_162_1, updated 15 September 2026, for the count, the revised July figure and the three-year series.
- Claimant count by age, Canterbury district, for the age split.
- Claimant count, Kent local authority areas, for the county table.
- Claimant rate, Canterbury, Kent and UK, for the rates.
- Claimant count source notes, ONS, for the definition.
All changes quoted here come from the same nomis series as published on 15 September 2026, so they compare like with like. Contains public sector information licensed under the Open Government Licence v3.0.
Have your say