
3,250 people claimed unemployment-related benefits in the Canterbury district in October, up 90 in a month. Claimants aged 16 to 24 rose 95 in a year to 805.
3,250 people were claiming unemployment-related benefits in the Canterbury district in October 2026. That is 90 more than in September and 130 more than in October 2025.
The figures are from the Office for National Statistics claimant count. Nomis published them at 7am today. The count covers the whole district: Canterbury, Whitstable, Herne Bay and the villages.
Overview
- 3,250 claimants in October, 3.3 per cent of residents aged 16 to 64.
- Up 90 on September and up 130 (4.2 per cent) on a year ago.
- 805 aged 16 to 24, up 95 in a year. The 25 to 49 group fell by 40.
- The district’s rise over the year was the fourth-smallest of Kent’s 12 districts.
Who is claiming
| Age group | October 2026 | Change on September | Change on a year ago |
|---|---|---|---|
| 16 to 24 | 805 | up 30 | up 95 |
| 25 to 49 | 1,645 | up 30 | down 40 |
| 50 and over | 800 | up 30 | up 80 |
| All ages | 3,250 | up 90 | up 130 |
Source: ONS claimant count by age, via Nomis.
The whole rise over the year is among the youngest and oldest claimants. Claimants aged 16 to 24 went up 13 per cent, from 710 to 805. Those aged 50 and over went up 11 per cent, from 720 to 800. The middle group, 25 to 49, is smaller than it was a year ago.
The under-25 figure is the highest since September 2021, when it was 815. That comparison rests on a single provisional month, though. The ONS revises the latest month when the next figures come out, and the gap to this April’s 785 is only 20.
How the district compares
The district’s rate is 3.3 per cent of residents aged 16 to 64. That is below Kent at 3.4 per cent and England at 4.1 per cent.
Over the year, the count rose more slowly here than across the county. Kent’s total went up 5.2 per cent, from 32,210 to 33,900. England’s went up 3.3 per cent.
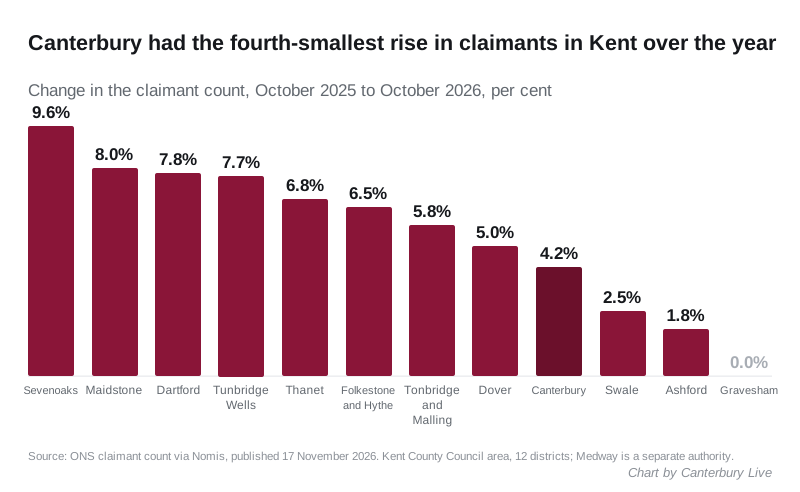
| District | October 2025 | October 2026 | Change |
|---|---|---|---|
| Sevenoaks | 1,565 | 1,715 | up 9.6% |
| Maidstone | 3,710 | 4,005 | up 8.0% |
| Dartford | 2,435 | 2,625 | up 7.8% |
| Tunbridge Wells | 1,695 | 1,825 | up 7.7% |
| Thanet | 4,190 | 4,475 | up 6.8% |
| Folkestone and Hythe | 2,380 | 2,535 | up 6.5% |
| Tonbridge and Malling | 1,975 | 2,090 | up 5.8% |
| Dover | 2,305 | 2,420 | up 5.0% |
| Canterbury | 3,120 | 3,250 | up 4.2% |
| Swale | 3,380 | 3,465 | up 2.5% |
| Ashford | 2,520 | 2,565 | up 1.8% |
| Gravesham | 2,935 | 2,935 | no change |
Source: ONS claimant count for Kent’s districts, via Nomis, and the same table for October 2025. Medway is a separate authority and is not included.
September’s figures have been revised down
The ONS revises the previous month each time. September’s district total is now 3,160, not the 3,235 first published. The under-25 figure for September is now 775, not 810.
That changes the headline of our September report, which said under-25 claimants were at their highest since 2021. On the revised figures they were not. A note has been added to that report.
What it means for you
The claimant count includes people on Jobseeker’s Allowance and people on Universal Credit who are required to look for work. Some of them are in work on low pay. It is not the official unemployment rate, which comes from a survey and is not published for districts each month.
The figures are not seasonally adjusted, so the fairest comparison is with the same month a year earlier. ONS rounds district counts to the nearest five.
If you are out of work, Jobcentre Plus is the starting point for Universal Credit and for youth employment support. Vacancies in the district are listed on our Canterbury jobs page.
The November figures are due from the ONS in mid-December.
Have your say